Introduction
The 2010 SendBlaster Survey was conducted over a seven-day period from July 22-29 and aimed at identifying the different users’ profiles, the satisfaction level, and collecting suggestions for improving SendBlaster.
The survey, made with Google Docs, was carried out through an online questionnaire presented to the SendBlaster PRO users, at the first launch of the software. Responses were entered anonymously by 727 SendBlaster customers.
The following report highlights the results.
Results
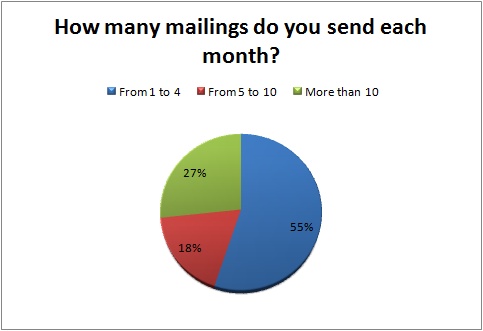
Q01. How many mailings do you send each month?
A little more than half of the respondents (55%) declared they use SendBlaster to handle up to 4 mailings per month. 18% of the respondents affirmed they send between 5 and 10 mailings a month, while around 1 out of 4 uses SendBlaster more intensely, sending over 10 mailings a month (27%).


Q02. How many subscribers do you have in your opt-in lists?
Almost 7 SendBlaster users out of 10 send their emails to small lists with less than 5.000 subscribers. 15% of the respondents have distribution lists of 5.000 to 10.000 users, while we can rate as “big mailers” the 9% of the users, who handle lists with over 50.000 addresses.


Q03. How many emails do you send each month?
36% of the respondents declared they send less than 1.000 emails per month. The percentage drops to 26% for those who send up to 5.000 emails and to 12% for those who send up to 10.000 emails. It is important to note that 11% of the respondents uses SendBlaster “massively” with a monthly average of 50.000 emails sent.


Q04. You are sending email campaigns with SendBlaster…
The number of users who use SendBlaster by themselves (for their businesses, or for their blogs) clearly surpass the number of users who send emails for third parties with a very high percentage: 73% vs. 8%. The remaining responders affirm to send emails for their own business and for their clients (19%).


Q05. In SendBlaster, you set up an SMTP given by…
The SMTP services chosen by most users are those offered by their own ISP (25%), followed by dedicated SMTP services (26%) and their hosting provider (24%). Those who choose the SMTP service provided by the email provider are a clear minority (9%). 14% of the respondents uses the direct feature instead of the one through SMTP.
This is a multiple choice question, hence the sum is greater than 100% as many respondents use more than one SMTP service


Q06. Which is the primary person that uses SendBlaster in your company?
One respondent out of two is the owner of the company where he uses SendBlaster. 25% of the users works in the Marketing/Sales area, 9% in the IT sector. Only the 7% of the respondents plays a role in the Administration.


Q07. Before you started using SendBlaster, how were you doing email marketing?
One user out of three (36%) had never handled email marketing campaigns before buying SendBlaster, while over 43% declares to have already done it, but only using their own email client. Just 9% of the users used a web based service (ESP) similar to Constant Contact and Mailchimp. The percentage is higher (12%) for those who have chosen SendBlaster after using different bulk mail software.


Q08. Based on the previous version of SendBlaster, how do you rate SendBlaster 2?
According to the large majority of participants (84%) SendBlaster 2 is better or significantly better than previous versions.


Q09. What is your favorite feature introduced in SendBlaster 2?
41% of respondents declared that their favorite feature introduced in SendBlaster 2 is the integration with Google Analytics & TrackReports. 34% of users chose the spam score checking tool and 32% the schedule email delivery.


Q10. How satisfied are you with SendBlaster? (From a scale of 1 to 5)
The 17% of the users expresses the highest rate of satisfaction (5), while the majority of the assessments, 57%, is just below (4). It is important to notice the low number of negative assessments, the 5% of the respondents. Altogether, the average rate of satisfaction equals 3.85.


Q11. How satisfied are you with our website SendBlaster.com? (From a scale of 1 to 5)
The 11% of the users expresses the highest rate of satisfaction (5), while the majority of the responses, 45%, is just below (4). We recorded a low number of negative assessments, the 7% of the respondents. Altogether, the average rate of satisfaction equals 3.60.


Q12, Q13, Q14 More than 300 users have left comments on their experience with SendBlaster and gave us useful suggestions on how to improve our services.
The responses reveal very useful information that we will utilize to improve our software, our website and the overall customer experience.
Thank you for everyone who took the time to fill out the survey.